
What is scientific evidence?
For scientists, scientific evidence is information collected via rigorous scientific methods that changes their belief in the truth of factual claims of the first to the fourth kind. Positive evidence increases scientists’ belief that the claim is true while negative evidence decreases it (or equivalently, increases their belief that the claim is false).Footnote 1
Strength of evidence
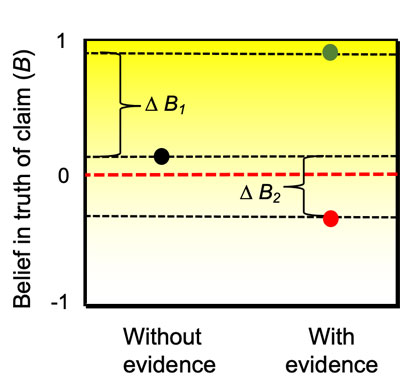
Scientific evidence varies in quality. High quality or strong evidence is that for which the change in scientists’ belief in the truth of the claim is large, weak evidence is that for which the change is small.Footnote 2 This change in belief is relative to scientists’ belief in the absence of the evidence (the “counterfactual”) (Fig. 1).
-
Fig. 1 - Text version
Fig. 1. Scientists’ belief in the truth of a claim can range from absolute conviction that the claim is false (B = -1) to absolute conviction it is true (B = 1). In this hypothetical example, the scientist has a mild belief the claim is true (black dot) before seeing the evidence under consideration. Strong positive evidence results in a large increase (ΔB1) in their belief that the claim is true (green dot). By contrast, weak negative evidence results in a smaller decrease (ΔB2) in their belief that the claim is true (red dot).
Strength of evidence underlying causal hypotheses
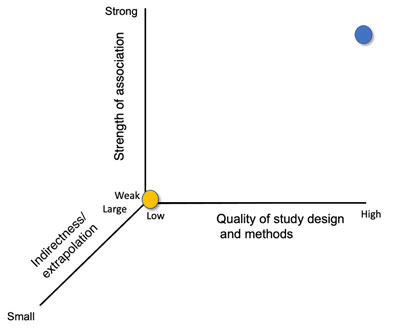
For scientists, the strength of the evidence provided by a scientific study is determined by: (1) the quality of the study design and the methods used, including study execution; (2) the extent of indirectness or extrapolation; and (3) the strength of the association between hypothesized cause and effect (Fig. 2).Footnote 3
-
Fig. 2 - Text version
Fig. 2. The three attributes that determine the strength of the evidence provided by a scientific study. The blue circle represents a study providing strong evidence (high quality study design and methods, strong association between cause and effect and small indirectness & extrapolation; the orange dot a study providing weak evidence (poor quality study design and methods, large indirectness & extrapolation, and weak association)
Study design and methods
Scientists test hypotheses by comparing their predictions with observed results. High quality designs and methods are those for which, in drawing an inference about the truth or falsity of the hypothesis based on this comparison, an error is unlikely to be made.
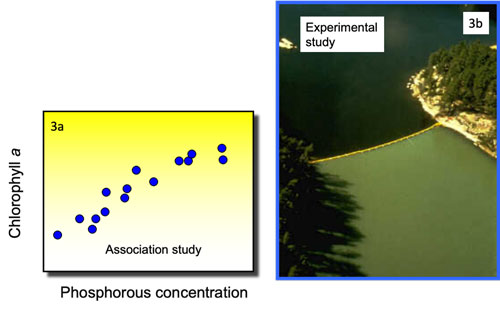
Consider, for example, the causal hypothesis that algae growth in lakes is determined by the concentration of phosphorous (a chemical found in fertilizer and sewage) in the water. One way to test this hypothesis involves sampling a set of lakes and looking at the relationship between phosphorous concentration and algae growth. In this association study, the hypothesis predicts that phosphorous concentration and chlorophyll a (an indicator of algal growth) will be positively related (Fig. 3a). Another study design involves adding phosphorous to a small bay isolated from the main body of a lake with an impermeable plastic curtain that extends to the bottom. In this experimental study design, the prediction is that the algal growth in the bay will be greater than in main body of the lake (Fig. 3b).
The strength of the evidence provided by the study shown in Fig. 3b is greater. Why? Because here scientists are deliberately manipulating the hypothesized causal factor, and there is a (reasonably) good experimental control treatment — in this case, the main body of the lake. In the study shown in Fig. 3a, there is no manipulation, and therefore no formal control. And because there is no formal control, even if the predicted positive relationship obtains, inferring that increasing phosphorous causes an increase in algal production is problematic.Footnote 4
-
Fig. 3 - Text version
Fig. 3. The results of two different studies (association (3a) and experimental (3b)) testing the causal hypothesis that algal production in lakes is determined by phosphorous concentration. Both studies provide positive evidence, as observed results match predictions. But which is more compelling?
Another important attribute of study design is the degree of replication or sample size. In the lake example, one could imagine two different degrees of replication: (1) in the association study, five versus 25 lakes are sampled; (2) in the experimental study, one versus five different lakes have the barrier installed. In both cases, the strength of the evidence provided by the latter design is greater than the former because a larger sample size reduces the likelihood that the predicted pattern occurs simply by chance.
A third important attribute is the level and appropriateness of study control. In experimental studies, the units of observation are assigned by the investigator to different groups (e.g., in the second experimental lake study, there might be five such units (lakes), each of which included a control (the main lake) and a treatment (the bay). A well-controlled study is one in which the treatment and control groups differ only with respect to the causal factors being tested. In such a study, the inference that observed differences between the control and experimental groups is due to these factors is very likely valid. In poorly controlled studies, there are one or more systematic differences between the two groups that may affect the study results: as a result, the effects (if any) of the causal factors is confounded by these differences. For example, in a study of the effects of prior vaccination on hospitalization,Footnote 5 researchers looked at cases of people hospitalized with COVID-19 and compared the odds of them being fully vaccinated with an mRNA vaccine (exposed, breakthrough cases) versus being unvaccinated (unexposed) versus controls hospitalized with other conditions. The finding that COVID-19 hospitalization was strongly associated with a lower likelihood of vaccination could also arise if vaccine breakthrough cases were systematically more likely to be hospitalized for COVID-19 of lesser severity than unvaccinated patients.
The quality of a study is also determined by how well the planned study was executed. Almost inevitably, logistic, time and resource constraints will lead to differences in what was planned, and what was actually done. These differences can introduce biasesFootnote 6 of various types. For example, in clinical trials, systematic differences between patients who drop out versus those who stay enrolled can introduce attrition bias.Footnote 7 Substantial biases can also result where disruptions such as extreme weather events, wars and even pandemicsFootnote 8 can lead to considerable missing data in monitoring and surveillance programs.
Indirectness and extrapolation
Indirectness and extrapolation capture the difference between the context that is the real interest of the decision-maker, and the context, outcomes, populations or situations captured by the study itself.
Extrapolation can take many forms. In pre-clinical drug studies or toxicological studies, the effects of drugs or contaminants on people are inferred from their effects on rats. In many types of environmental and clinical studies, short-term or local effects are used to make inferences about longer-term or regional effects, and lab studies are extrapolated to the field. And almost invariably, the effects or outcomes of actual interest are inferred from more proximate indicators of effects — for example, the effects of contaminants on human reproductive health (the outcome of real interest) might be inferred from the relationship between mercury (the selected contaminant) in hair and male sperm counts (the indicator).
Extrapolation of any type involves the implicit (and usually unvalidated) assumption that the context/outcome/population/situation that one is really interested in behaves like the context/outcome/population/situation that is the focus of the study. But this is often not the case: people and rats behave differently and have different physiologies. Some effects are transient and last only a short time, and some never show up for decades. And so on. So the greater the extrapolation and indirectness, the lower the strength of the evidence provided — all else being equal.
Strength of association
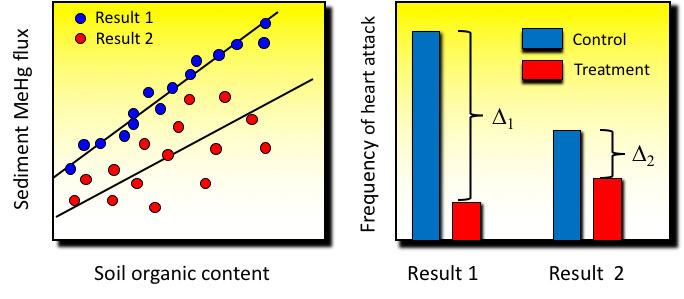
Scientific hypotheses yield predictions — the patterns or associations one expects if the hypothesis is true. One way to think of the “strength” of an association (often called the “effect size”) between an hypothesized cause and its effect is how distinct it is: strong associations are those which are very distinct, and weak associations are those for which it is unclear whether there is any association whatsoever (Fig. 4). A weak association that is nonetheless consistent with predictions could well have arisen from chance. By contrast, a strong association consistent with predictions is less likely to have done so. So the stronger the association, the stronger the evidence — all else being equal.
-
Fig. 4 - Text version
Fig. 4. Strength of association. The left panel shows two different sets of possible results (blue, red) of a hypothetical association study designed to test the hypothesis that mercury concentration in reservoirs created by dams is determined by the organic content of the flooded soils. The panel shows the amount of methyl mercury released from flooded soils (sediment MeHg flux) and the amount of organic matter in the flooded soils (soil organic content) for a sample of 15 reservoirs in northern Canada. The right panel shows two different possible results of a hypothetical clinical trial of a new drug to prevent heart attacks, where patients were randomized into two groups, one receiving the current “gold standard” drug for heart attack prevention (control) and the other the new drug (treatment). In both cases, the first set of results shows a stronger association (a “tighter” relationship in the first case, a larger difference cx xin the second case) between the hypothesized cause and its effect. Hence in both cases, the strength of the evidence provided by the first set of results exceeds that of the second.
Strength of evidence and decision-making
All (rational) policy decisions are based on (usually implicit) causal hypotheses that connect the decision with desired or undesired outcomes. The predicted effects of a decision on desired or undesired outcomes rely on these hypotheses being at least approximately true. For example, carbon taxes are based on the causal hypothesis that a tax above a certain size incentivizes individuals and institutions to reduce fossil fuel consumption. If this hypothesis is false, then a carbon tax is unlikely to reduce fossil fuel consumption.
In evaluating candidate decisions, decision-makers should ask scientists: “How strong is the evidence that the underlying causal hypotheses are true?” The stronger the evidence, the greater the confidence that they are true, and hence, the greater the likelihood that predicted effects will indeed materialize. If the evidence is weak, then decision-makers should think seriously about the consequences if they are not true.